Figure 3.

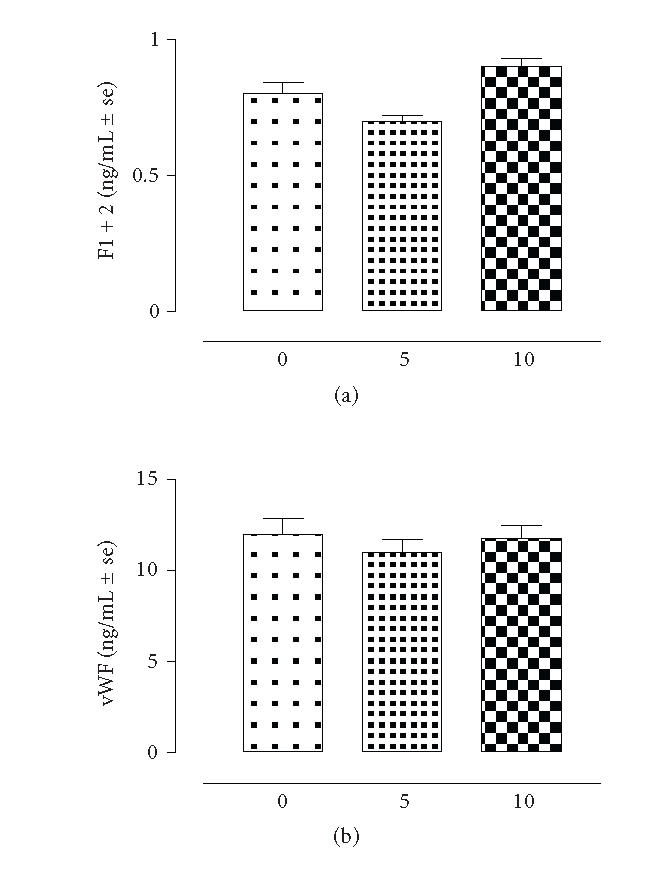
Plasma F1 + 2 and von Willebrand levels in rats (n = 8) subjected to experimental peritoneal adhesion development. The time is expressed in days. Significant differences from time 0 values are expressed as *P < .01; **P < .001.

Plasma F1 + 2 and von Willebrand levels in rats (n = 8) subjected to experimental peritoneal adhesion development. The time is expressed in days. Significant differences from time 0 values are expressed as *P < .01; **P < .001.