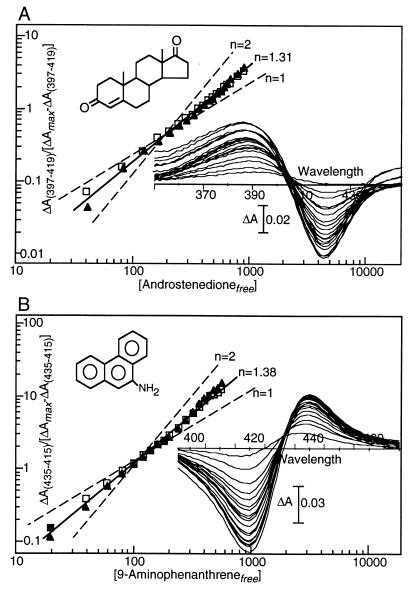
Figure 1.
Ligand-induced spectral shifts of P450eryF. (A) Effects of androstenedione. Duplicate assays were performed by using 19 substrate concentrations ranging from 40–880 μM; difference spectra from a single assay are shown. Data from two experiments (open and closed symbols) are presented in the form of a Hill plot: the Hill coefficient observed, n = 1.31 ± 0.6, is shown by a solid line, and plots for n = 1 and 2 are shown as dashed lines for comparison. (B) Spectral shifts induced by 9-aminophenanthrene. Duplicate assays were performed by using 19 ligand concentrations ranging from 20 μM-560 μM. Data from two experiments (open and closed symbols) are presented in the form of a Hill plot: the Hill coefficient observed, n = 1.38 ± 0.2, is shown by a solid line, and plots for n = 1 and 2 are shown as dashed lines for comparison.

