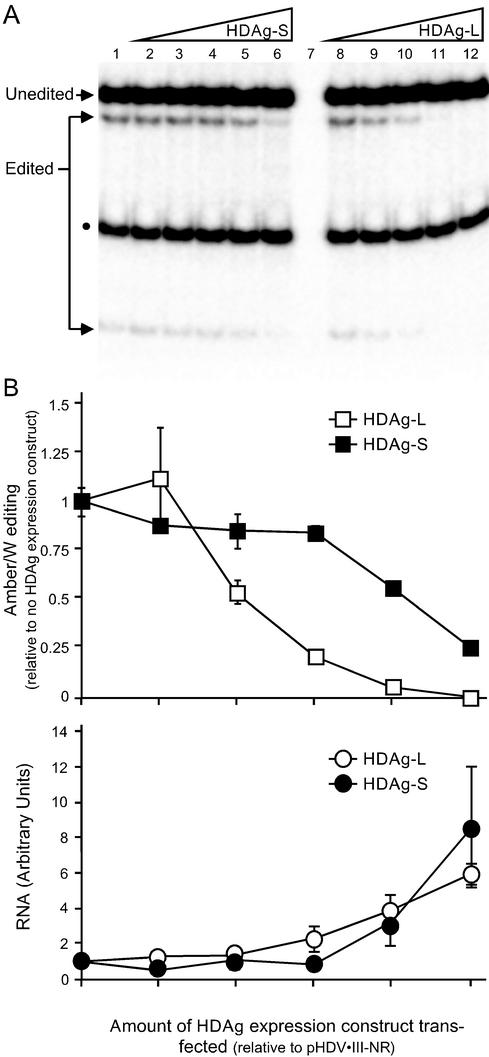
FIG. 1.
Inhibition of RNA editing at the HDV genotype III amber/W site by HDAg-S and HDAg-L. (A) Huh-7 cells in 12-well plates were cotransfected, as described in Materials and Methods, with 500 ng of the nonreplicating genotype III antigenomic RNA expression construct pHDV-III-NR and various amounts of the genotype III HDAg-S or HDAg-L expression constructs pHDAg-S-III (lanes 2 to 6) and pHDAg-L-III (lanes 8 to 12). The amounts of HDAg expression construct cotransfected were as follows: lane 1, none; lanes 2 and 8, 0.05 ng; lanes 3 and 9, 0.5 ng; lanes 4 and 10, 5 ng; lanes 5 and 11, 50 ng; lanes 6 and 12, 500 ng. As a negative control for the RT-PCR, cells were transfected with 500 ng each of pHDAg-S-III and pHDAg-L-III (lane 7). The RNA was harvested 2 days posttransfection and analyzed for editing at the amber/W site by RT-PCR-StyI digestion as described previously (36), except that the primers used were IIINR-1 and IIINR-2, as described in Materials and Methods. Editing creates a StyI restriction digestion site that is not present in unedited RNA. Thebands due to edited and unedited RNA are labeled; the smaller band indicated by a black dot is due to a preexisting StyI site in the cDNA that is not affected by editing. Results shown are representative of three independent experiments. (B) Effect of amount of HDAg expression construct cotransfected on editing and nonreplicating RNA levels.In the upper part of panel B is a graphical representation of results from panel A combined with the results from two independent experiments. Because of variations in the amount of editing observed in the different experiments (between 5% and 10%), the results for each experiment were first normalized to the level of editing observed in the absence of a cotransfected HDAg expression construct. Error bars indicate standard deviations; for some points the error bars are not visible because they are smaller than the symbols used for the data. Symbols: ▪, cotransfection with pHDAg-S-III; □, cotransfection with pHDAg-L-III. In the lower part of panel B is a graph of Northern blot analysis of the antigenomic pHDV-III-NR RNA. RNA levels are presented as the fold increase relative to the amount of nonreplicating RNA in cells with no HDAg cotransfected.

