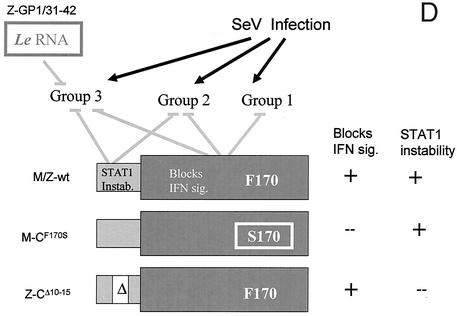
FIG. 1.
Comparison of host mRNA levels in 2fTGH cells infected with various SeVs. (A to C) Parallel cultures of 2fTGH cells were infected with 20 PFU of the various SeVs per cell. Total cytoplasmic RNA was prepared with Trizol at 24 hpi, and equal amounts (10 μg) were used as a template for oligo(dT)-primed [33P]cDNA synthesis. The [33P]cDNA was annealed to triplicate DNAs arrayed on nylon membranes, and the [33P]cDNA bound was quantitated in a PhosphorImager. The graphs show the fold increase in each mRNA relative to the mock control. (D) Schematic representation of the viral mutations and their effects on host gene activation. The C proteins are shown as two telescoping boxes representing the longer (C′ and C) and shorter (Y1 and Y2) C proteins, whose activities during infection, and the mutations investigated, are indicated. The promoter mutation GP42 is thought to exert its effect via mutant leader (Le) RNA. The presumed requirement for the various wt genetic elements to prevent host gene activation is shown. The names of the mutant SeVs used are also indicated. Instab., instability; sig., signaling.


