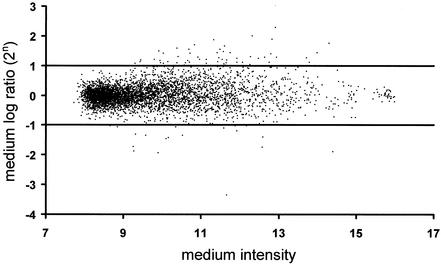
FIG. 1.
Expression levels of 4,600 genes in response to adenovirus infection. Arrays were hybridized with cDNA pools derived from adenovirus-infected and mock-infected HeLa cells. Cells were infected at a multiplicity of infection of 10, for 24 h, followed by RNA preparation and array hybridization. The mean log2 ratio M of signal intensities (with virus versus without virus, eight spots for each gene on four different microarrays) is plotted against the average signal intensity A (logarithmic scale, arbitrary units) for each gene under examination.

