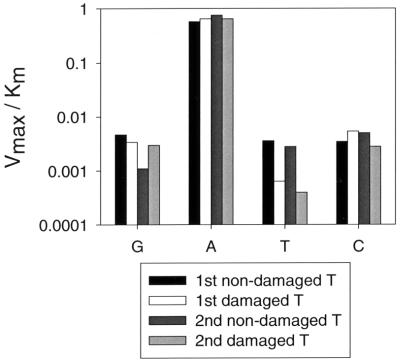
Figure 4.
Comparison of deoxynucleotide incorporation opposite the nondamaged and T–T dimer template residues. The Vmax/Km parameters (y axis) listed in Table 1 are shown for G, A, T, and C incorporation (x axis) opposite each of the two nondamaged and two damaged template T residues.

