
Fig A2.
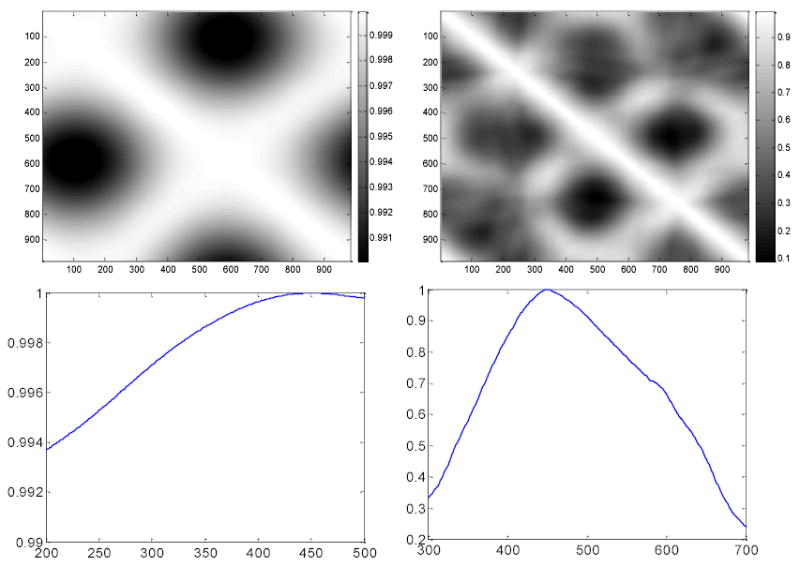
Correlation coefficients matrix of data signal among projection views from the sinogram of the QA nearly-symmetric cylinder phantom (top left) and the asymmetric Shoulder phantom (top right). Bottom shows their horizontal profiles across their centers respectively. The wider range of non-negligible values on bottom left is due to the high symmetric property of the QA phantom, see Fig. 4. The sinogram of the QA phantom is almost uniform along the view direction. Therefore, the correlation coefficients between different views have a wider range of nonnegligible values. When the phantom becomes more asymmetric, such as the Shoulder phantom in Fig. 1, the sinogram becomes more non-uniform along the view direction and, therefore, the correlation coefficients between nearby views have a narrow range of non-negligible values, as shown on the bottom right.