
Fig. 5.
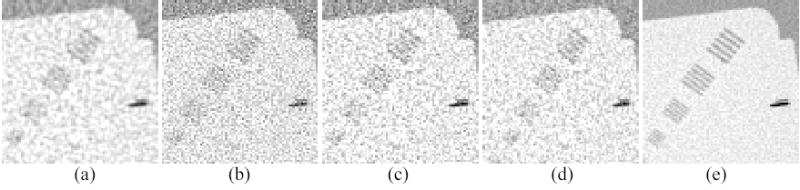
Zoomed images of the sets of strip bars from the corresponding images of Fig. 4: (a) Result from the Hanning filter; (b) from the PRWLS+SOR strategy; (c) from the GS-PRWLS strategy; (d) from the KL-PWLS strategy; and (e) from the average of 19 repeated measurements (as the gold standard).