Figure 3.
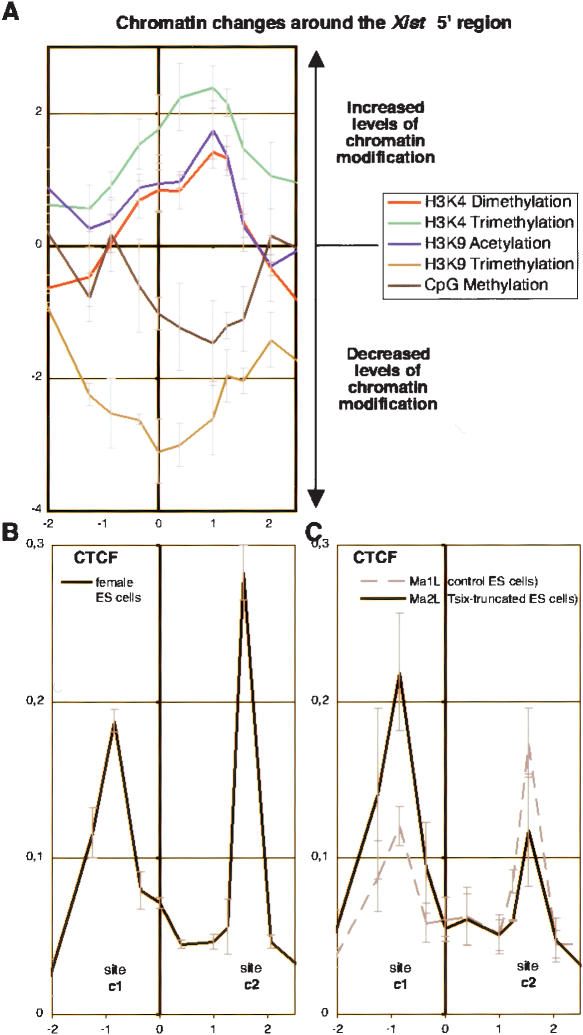
CTCF binding to the Xist 5′ region. (A) The graph shows the ratio between Tsix-truncated (Ma2L) and wild-type (Ma1L) obtained for each epigenetic modification analyzed in Figure 1. Note that ratios are plotted in a Log2 scale against the genomic position according to the Xist transcriptional start site. (B) Analysis of CTCF binding across the Xist 5′ region in female ES cells. The graph shows the average percent immunoprecipitation (n = 2) calculated for each position. (C) Similar analysis of CTCF binding in wild-type (Ma1L, dotted lines) and Tsix-truncated (Ma2L, plain lines) male ES cells (n = 3 for both cell lines).

