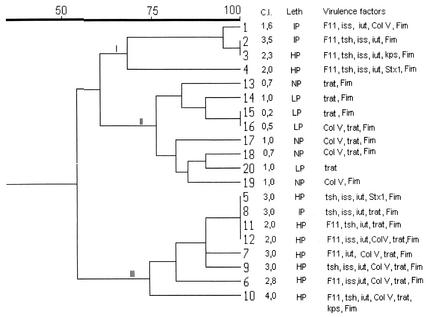
FIG. 1.
Dendrogram of E. coli isolates from chickens with cellulitis (strains 1 to 12) and from feces of healthy chickens (strains 13 to 20) based on simple matching similarity coefficients, calculated from REP-PCR analysis data. The virulence factors, lethality (Leth), and cellulitis index (C.I.) of each isolate are also shown. NP, not pathogenic; LP, low pathogenicity; IP, intermediate pathogenicity; HP, high pathogenicity.

