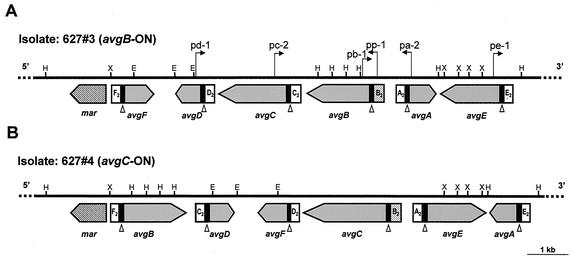
FIG. 3.
Schematic representation, partial restriction map, genomic organization, and comparison of the M. agalactiae avg locus for two isolates obtained 2 weeks apart from the same chronically infected ewe (animal #627). The thick solid line represents about 10 kb of the avg locus of M. agalactiae isolate 627#3 (A) or isolate 627#4 (B). The positions of HindIII (H), EcoRI (E), and XbaI (X) restriction sites are indicated. The locations and orientations of six avg genes are indicated by large shaded arrows. A solid box 5′ to each avg gene represents homologous cassette no. 1. Cassette no. 2 of each avg gene is indicated. The position of the avg-B2 promoter cassette is indicated by a stippled box. The location of the putative tyrosine recombinase gene mar is indicated by a cross-hatched arrow. The open triangles indicate the location of the DNA recombination vis-like sites within conserved cassette no. 1 of each avg gene. The locations of oligonucleotide primers used in this study for PCR amplification across the junction between the avg-B2 promoter and the avg structural genes are indicated by small arrows.

