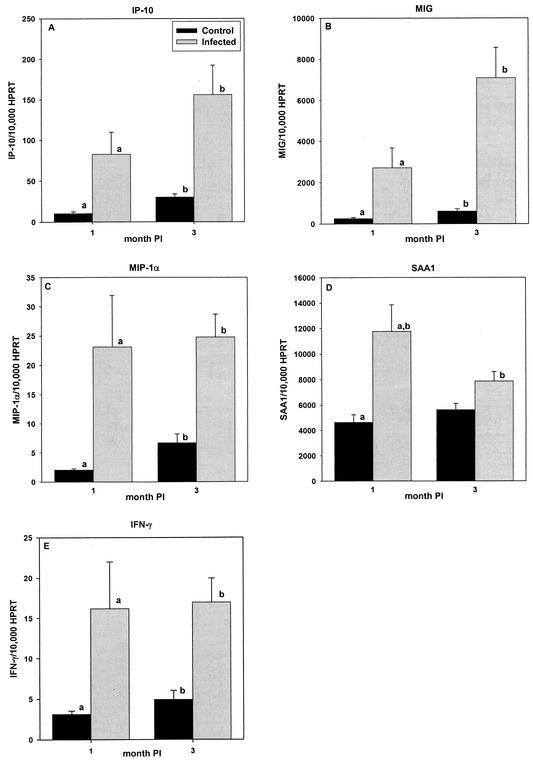
FIG. 3.
The mean number of MIP-1α (A), MIG (B), IP-10 (C), SAA1 (D), and IFN-γ (E) mRNA molecules relative to the number of HPRT mRNA molecules in the ceca of naïve control and H. hepaticus-infected A/JCr mice at months 1 and 3 postinoculation (PI). Data represent mean plus or minus standard error of the mean of 10 mice per group. Letters (a and b) represent statistically significant (P < 0.05) difference according to Student-Newman-Keuls, one-way ANOVA.

