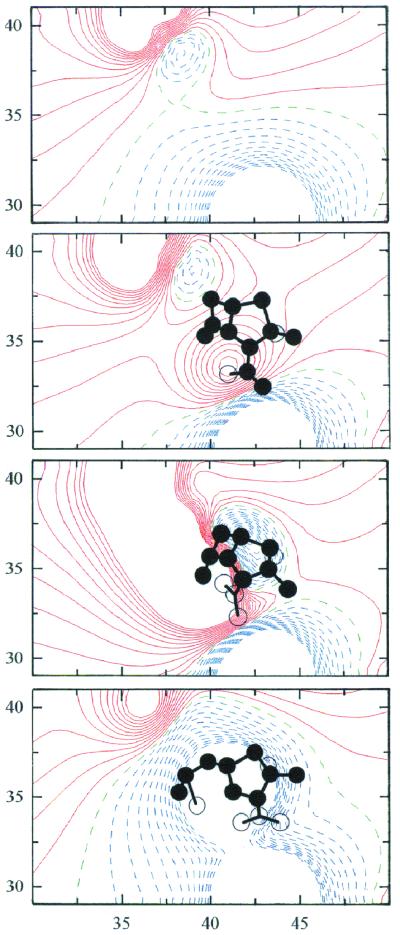
Figure 3.
Contour maps of the electrostatic potential in the active site of TEM-1 β-lactamase for E, ES, T1, and EY (top to bottom). The contour levels are calculated at intervals of 0.5 kcal/mol⋅e (≈0.83 RT/e). Solid red contours indicate negative isopotential curves; broken blue contours show positive isopotential curves while broken green contours represent curves of 0 potential. The contours are deleted at distances less than 2.5 Å from hydrogen-bound atoms. The maps are drawn for x = 30–50 Å and y = 28–42 Å with respect to the crystal axis system of the E166N acylenzyme (4). The contour maps are projected along the z axis from z = 29.5 Å to z = 32.5 Å. [The level of z = 31 Å corresponds to the position of Nɛ(K73).] The circles represent substrate or acyl atoms viewed in projection within (filled) and outside (unfilled) of the 3-Å slab projected here and identify catalytically important regions where steep gradients are visible.

