
Figure 1.
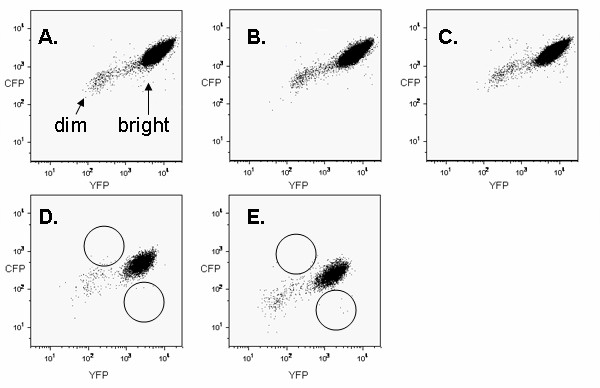
FACS dot plots (106 events) showing fluorescent profiles of three R26CY MEF cell lines (A-C) and two ES cell lines (D, E). Arrows in panel A indicate "dim" and "bright" events in MEF plots. Circles in panels D and E indicate areas where monochromatic variants would be expected to be located.