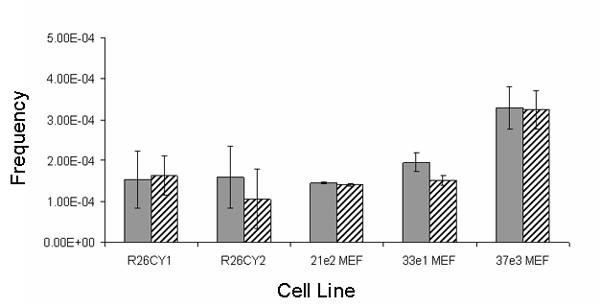
Figure 4.

Abundance of spontaneously occurring apparent monochromatic variants. Solid and hatched bars indicate frequencies of cells exhibiting only CFP or only YFP, respectively. R26CY1 and R26CY2 are data from the two ES cells lines. 21e2MEF, 33e1MEF and 37e3MEF are data from the three MEF lines. Error bars indicate the standard errors of the means.
