
Figure 3.
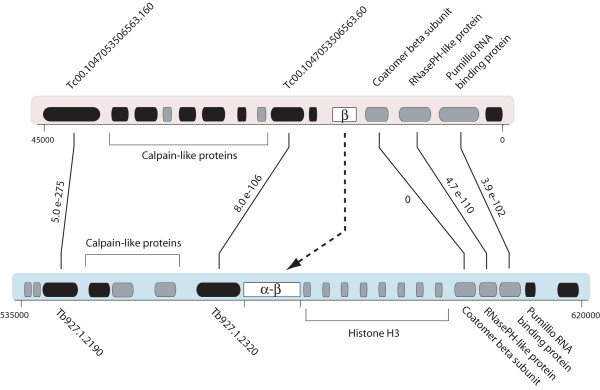
Comparison of gene order around the tubulin tandem array in T. brucei (shaded blue) and contig 5635 in T. cruzi (shaded red). Predicted CDS are shown in grey, hypothetical CDS in black. Genes with significant reciprocal BLAST matches are connected by vertical lines and labelled, showing the relevant e score. The dashed line connects the putative tubulin homologs.