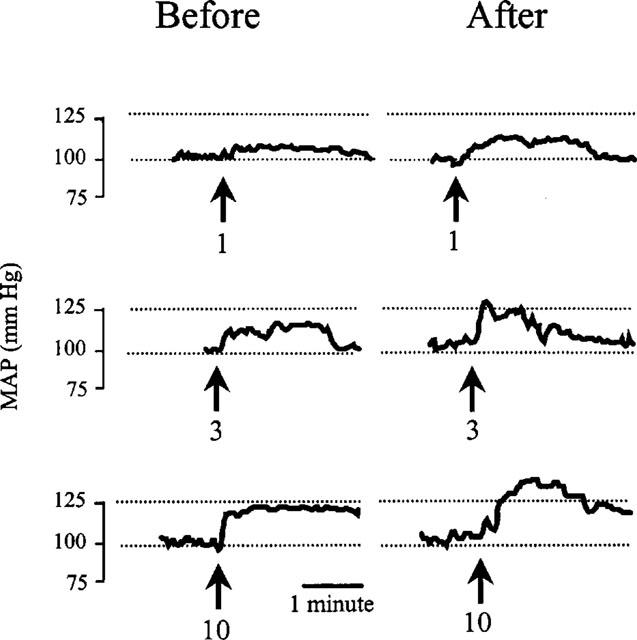
Figure 2.

Typical traces of blood pressure recordings showing the mean arterial pressure (MAP) responses to intravenous injections of 1, 3, or 10 ng kg−1 of arginine-vasopressin before (left panels) and after (right panels) micro-injection of 10 nmol of neurotensin into the ventral tegmental area of conscious rats. Arrows indicate the moment of vasopressin injections. Numbers wth the arrows refer to the vasopressin doses in ng kg−1.
