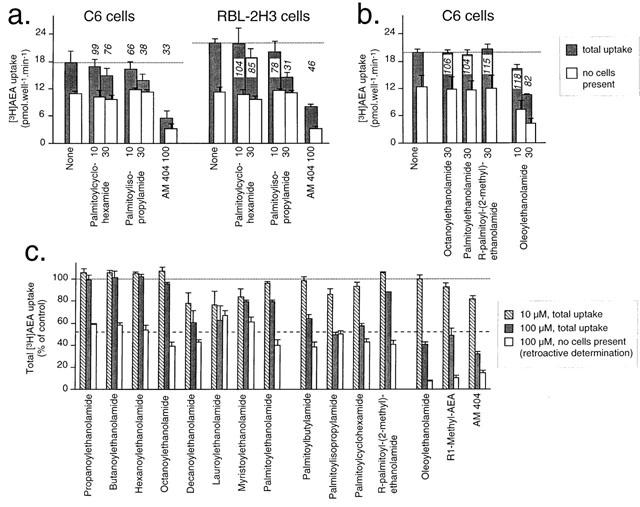
Figure 6.

Effect of palmitoylethanolamide and related compounds upon the uptake of 10 μM [3H]-AEA into rat C6 glioma and RBL-2H3 basophilic leukaemia cells (a,b) shown are means±s.e.mean (n=3) of the total uptake in the absence and presence of cells. The numbers given above (or enclosed within) the columns are the specific uptake remaining in the presence of the test compounds, calculated as 100×(mean total uptake - mean uptake, no cells present)/(mean total uptake in the absence of compound - mean uptake, no cells present in the absence of compound). The dotted line shows the mean total uptake in the absence of test compound (i.e. ‘none'). (c) effects on the total uptake of [3H]-AEA into RBL-2H3 cells. Shown are means±s.e.mean, n=3. The dotted line shows the mean total uptake in the absence of test compound (i.e. 100%). The dashed line is a retroactive estimation of the mean percentage of the total [3H]-AEA uptake due to binding to the cell culture wells, determined from the data shown as ‘none' for the RBL-2H3 cells in panel a. The unfilled columns in the experiments shown in panel c were calculated from means of three separate experiments where the effects of the compounds upon the binding to [3H]-AEA to culture wells was determined. The observed figure was then normalized to 52% (i.e. the dashed line). Thus, for example, a compound producing a 34% inhibition of the binding to the well would have an unfilled column of 52×(0.66)=34% of total [3H]-AEA uptake.
