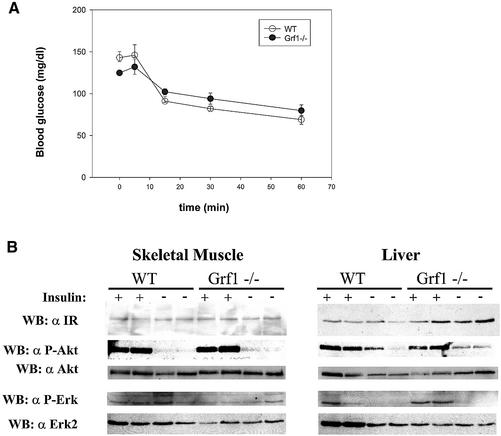
Fig. 4. Assessment of insulin responsiveness. (A) An insulin tolerance test was performed on fed animals at 8–12 weeks of age. Insulin (1 U/kg) was injected intraperitoneally and glucose levels were sampled at the indicated time. The graph represents the average ± SEM of six wild-type and six GRF1–/– animals. Similar results were obtained in two additional insulin tolerance tests. (B) Insulin-stimulated signal transduction was analyzed in tissues from wild-type and knockout animals. Animals were fasted overnight and then treated with a bolus insulin injection (5 U). Non-stimulated controls were subjected to a saline injection. Tissues were lysed and evaluated by western analysis as shown.

An official website of the United States government
Here's how you know
Official websites use .gov
A
.gov website belongs to an official
government organization in the United States.
Secure .gov websites use HTTPS
A lock (
) or https:// means you've safely
connected to the .gov website. Share sensitive
information only on official, secure websites.
