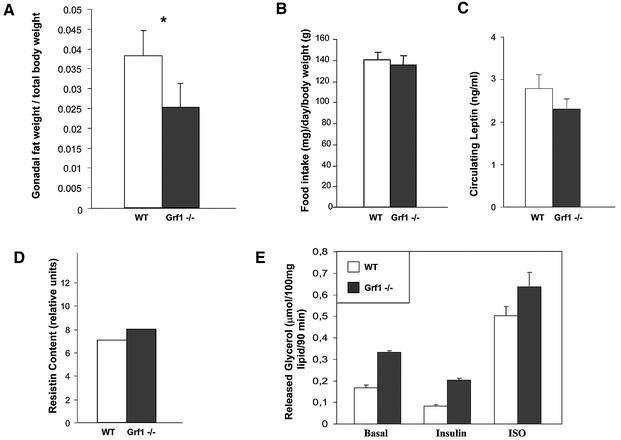
Fig. 5. Analysis of adipose storage and metabolism. (A) Gonadal fat pads were collected from male animals at 12–16 weeks of age. Weight of fat (wild type, 1.50 ± 0.07 g; knockout, 0.78 ± 0.16 g) was compared with overall body weight (wild type, 40.2 ± 0.7 g; knockout, 29.5 ± 1.5 g) and used to calculate the given ratios. Data represent the average fat:body comparisons ± SEM of four wild-type and six GRF1–/– mice. *P = 0.04. (B) Food intake was monitored daily in groups of wild-type and knockout animals during a period of 4 weeks. Prior to onset of the study, animals were given 1 week to adjust to feeding jars and ground chow. Results represent the average chow consumed per animal per day ± SEM from five wild-type and eight knockout animals. (C) Serum leptin was assessed from fed animals by ELISA. Results represent the average ± SEM circulating leptin levels of five wild-type and eight knockout animals. (D) For analysis of resistin expression, adipose tissue was collected from fasted animals and used for preparation of RNA. RT–PCR was performed to detect resistin expression, and densitometric analysis was used to assess relative levels of resistin from ethidium bromide-stained gels. RNA was prepared and evaluated independently from the fat pads of five wild-type and eight knockout animals. (E) Lipolysis was analyzed in isolated adipocytes of fed male mice (12 weeks of age). The rate of basal, insulin-stimulated (10–8 M), and isoproterenol-stimulated (ISO; 10–6 M) glycerol formation was measured. Data represent the average ± SEM rates of lipolysis of three wild-type and three knockout animals.

An official website of the United States government
Here's how you know
Official websites use .gov
A
.gov website belongs to an official
government organization in the United States.
Secure .gov websites use HTTPS
A lock (
) or https:// means you've safely
connected to the .gov website. Share sensitive
information only on official, secure websites.
