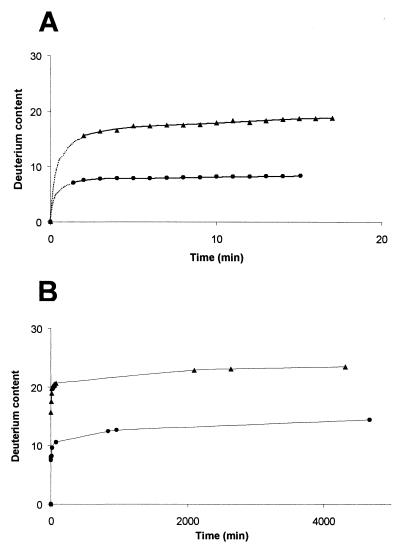
Figure 3.
Deuterium content of WALP16 (●) and WALP16(+10) (▴) incorporated in DMPC bilayers as a function of incubation time. A shows the time envelope from 0 to 15 min. The dotted line between 0 and 2 min represents an estimated extrapolation of the curve, because no data points were available in this region. B shows the time envelope from 0 to 5 × 10³ min.

