
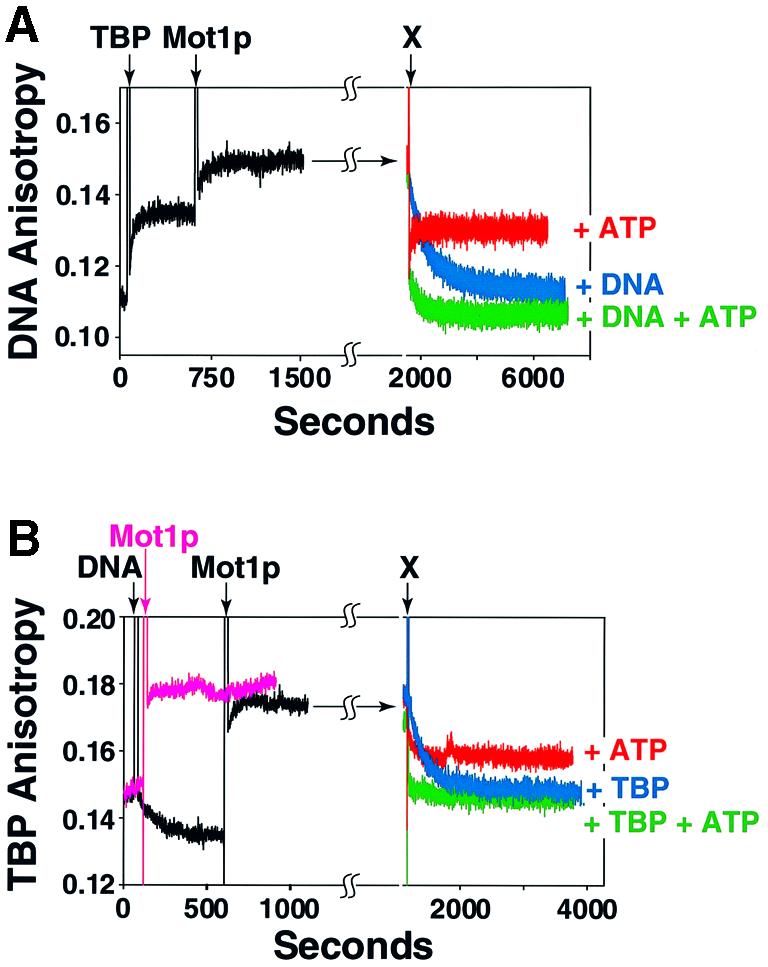
Fig. 4. Mapping the fate of ternary complex components following ATP-driven Mot1p-mediated dissociation. (A) A 1:1:1 ternary complex was formed by adding 50 nM of TBP (arrow, Alexa-labeled TBP added, marked TBP) followed by 50 nM Mot1p (arrow, marked Mot1p) to a 50 nM solution of 14Rox TATA DNA. Anisotropy was monitored and plotted as a function of time. Either 1 mM ATP (red trace, labeled +ATP), 1500 nM cold 14mer Ad2 MLP TATA (blue trace, labeled +DNA) or both 1 mM ATP and 1500 nM 14mer DNA (green trace, labeled +DNA +ATP) added to ternary complex (all additions marked by the arrow marked X, top); anisotropy was monitored and plotted as a function of time. (B) A parallel reaction performed exactly as in (A) except the added 50 nM Alexa 350-labeled TBP was monitored as fluorophore; as a control, Mot1p–TBP complex formation was monitored (pink trace). When present, cold TBP added to 1500 nM.