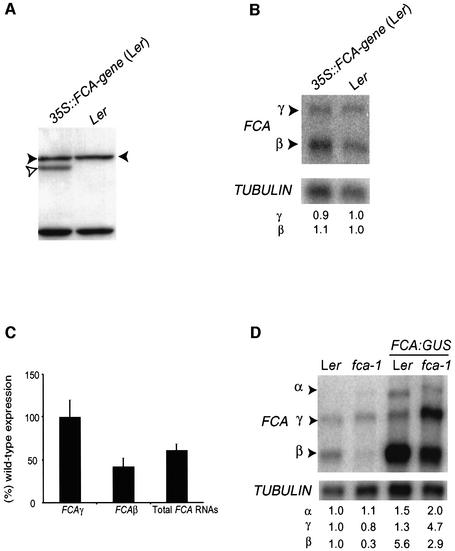
Fig. 6. FCA autoregulation controls the level of functional transcript γ. (A) Immunodetection of FCA protein. Western blot analysis of total soluble protein extracts from seedlings of Ler and the transgenic line 35S::FCA-gene (a 35S fusion to the FCA gene) in Ler. Filled and unfilled arrowheads denote endogenous and transgenic FCA proteins, respectively. Lower bands are unspecific binding products used as loading controls. (B) Northern blot analysis of poly(A)+ RNA isolated from Ler and the transgenic line 35S::FCA-gene in Ler [the same transgene as in (A)]. The blot was probed as indicated in Figure 2C. Numbers denote relative expression and were calculated as in Figure 2C. (C) Quantification of the FCA transcripts levels in the fca-1 mutant. Data are the average of six different experiments and the FCA transcript signals obtained by northern analysis were normalized against that for β-TUBULIN. (D) Northern blot analysis of poly(A)+ RNA isolated from Ler, fca-1, and the transgenic lines PFCA::FCAto exon 5:GUS in Ler and PFCA::FCAto exon 5:GUS in fca-1. The blot was probed as indicated in Figure 2C. Numbers denote relative expression and were calculated as in Figure 2C.

An official website of the United States government
Here's how you know
Official websites use .gov
A
.gov website belongs to an official
government organization in the United States.
Secure .gov websites use HTTPS
A lock (
) or https:// means you've safely
connected to the .gov website. Share sensitive
information only on official, secure websites.
