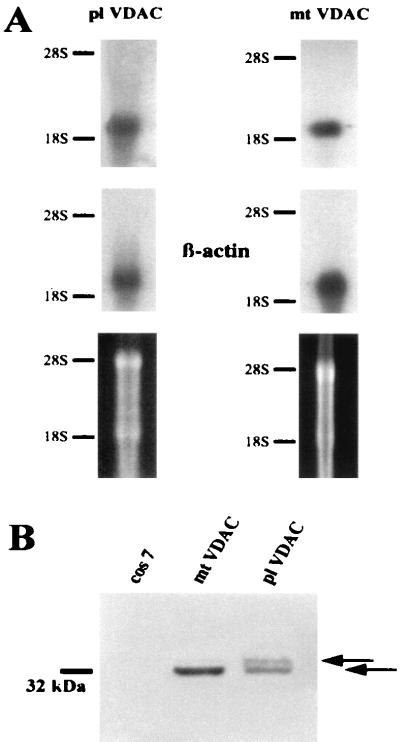
Figure 2.
Expression of mt-VDAC-1 and pl-VDAC-1 mRNA and proteins. (A) Northern blot of murine whole-brain mRNA hybridized with specific 5′ probes of pl-VDAC-1 and mt-VDAC-1 or with a β-actin probe as a control. The lower lane indicates ethidium bromide staining of the agarose gel used for Northern blotting. (B) Western blots of COS7 cells transiently transfected with expression constructs of mt-VDAC-1–myc and pl-VDAC-1–myc. The mt-VDAC-1–myc-transfected cells show a single band with the myc antibody at the expected position of 32 kDa; pl-VDAC-1–myc-transfected cells have two bands, a lower one in the range of the mt-VDAC-1 at 32 kDa and an upper one about 2 kDa above (arrows). The second band is considered to contain the unprocessed pl-VDAC-1–myc protein, because the difference in size matches exactly the length of the leader sequence.

