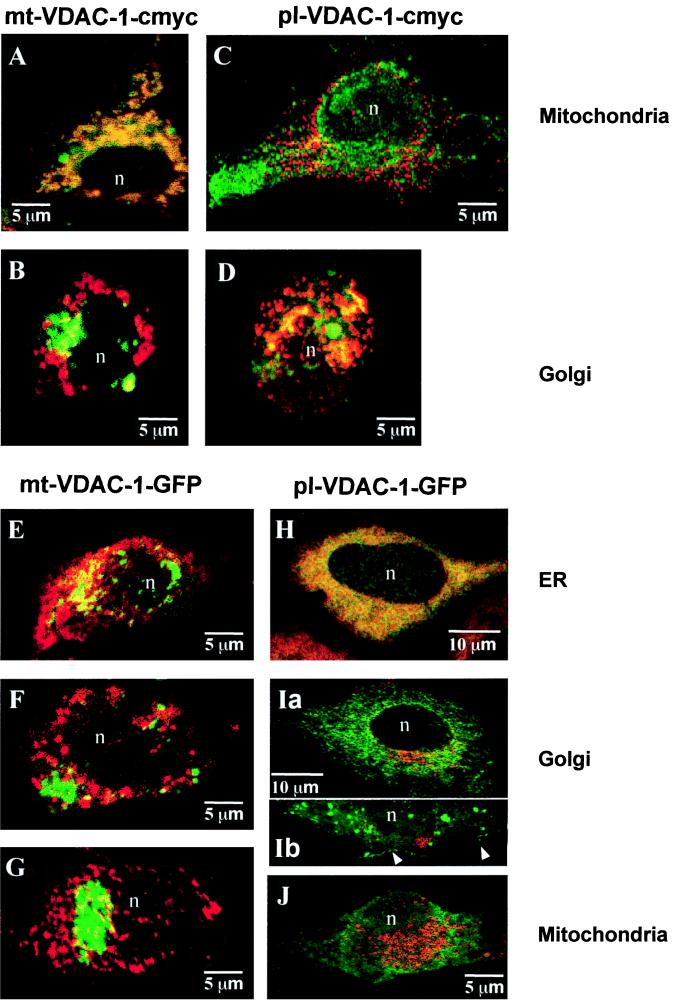
Figure 3.
Immunolocalization of transfected mt-VDAC-1–myc and pl-VDAC-1–myc by laser-scanning microscopy. (A) Double fluorescence of mt-VDAC-1–myc staining (red) versus mitochondrial staining with MitoTracker Green FM (green). (B) Golgi staining with Bodipy FL C5-ceramide (green). Significant overlap of mt-VDAC-1–myc (red) immunoreactivity is evident with the mitochondrial stain (green) resulting in orange fluorescence (A), whereas no overlap of mt-VDAC-1–myc labeling (red) occurs with the Golgi marker, which shows a green signal (B). (C and D) pl-VDAC-1–myc immunoreactivity (red) versus mitochondrial staining (green; C) or Golgi staining (green; D). pl-VDAC-1–myc shows little overlap with the mitochondrial marker (C) and a typical perinuclear Golgi-like distribution with significant overlap with the Golgi marker (D). (E–G) mt-VDAC-1–GFP staining in transiently transfected cells and labeling with markers for the ER (E), Golgi (F), and mitochondria (G; all in red). mt-VDAC-1–GFP translation results in an accumulation of aggregates that do not significantly overlap with staining of the compartment markers. (H–J) pl-VDAC-1–GFP staining after transient transfection. The same order of markers was used as indicated for mt-VDAC-1–GFP. Complete overlap of pl-VDAC-1–GFP with the ER resulting in orange fluorescence (H). In Ia, partial staining of the Golgi together with the ER is evident, whereas Ib shows vesicular and cell membrane staining (arrows). In J, no overlap of the mitochondrial staining with the pl-VDAC-1–GFP fluorescence is evident. In all panels, n > 5.

