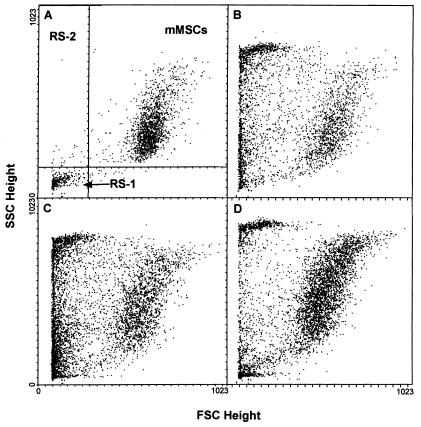
Figure 3.
FACS analysis of cells for size and granularity after different periods of incubation. Preliminary experiments indicated that the precursor–product relationships among the cell populations were more apparent in cultures that grew slowly (not shown). Therefore, the stock sample of MSCs selected for the experiment was previously shown to expand slowly in culture and have an unusually low cfu value of about 12% (see ref. 41). The cells were plated at a suboptimal density of 3 cells/cm2 that was equivalent to 1.0 cell/cm2 or less for samples that expanded more rapidly and had higher cfu values (see Fig. 1). (A) Analysis of cells in stationary culture at day 14. Lines indicate gating used to define RS-1 cells, RS-2 cells, and mMSCs. (B) Analysis on day 5 after initial plating. (C) Analysis on day 7 after initial plating. (D) Analysis on day 10 after initial plating. FSC, forward scattering of light that assays cell size; SSC, side scattering of light that assays cell granularity. Values in arbitrary units.

