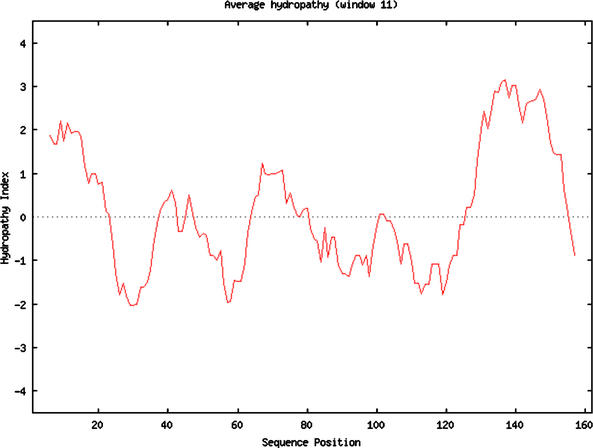
Figure 4.
Hydropathy plot of human aquaporin generated using the Kyte–Doolittle method and an 11-amino acid window. The perl program used to generate this plot was written by students in the Computational Biology course. Used with permission from http://www.bio.davidson.edu/courses/compbio/flc/sample_plots.html.

