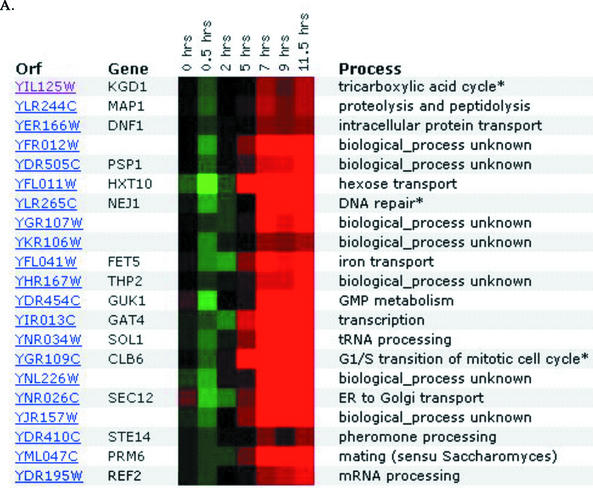
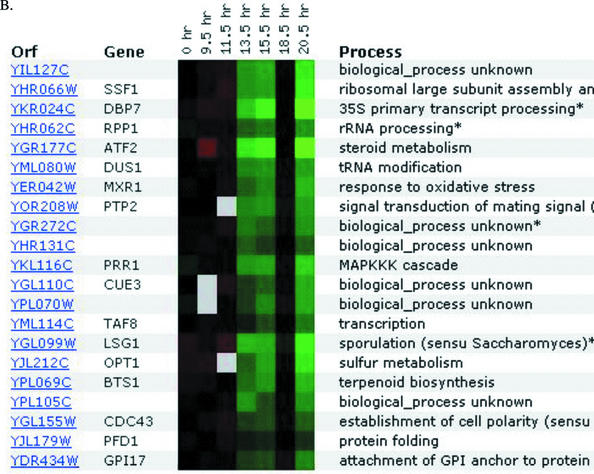
Figure 6.
DNA microarray expression data from Expression Connection (Table 1). A student submitted his annotated gene (A) and his nonannotated gene (B) to determine if their expression patterns were similar, as he predicted based on their chromosomal proximity. The gene KGD1 was repressed slightly (green boxes), and later induced (red boxes), while the ORF YIL127C was minimally induced and later repressed substantially over this time course. The sets of genes that clustered with the student's two genes have no members in common, nor do they share biological processes.


