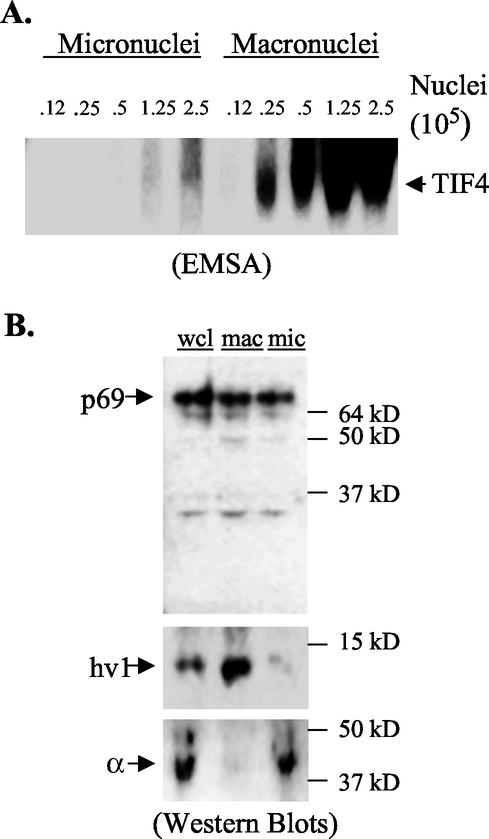
FIG. 6.
Distribution of p69 and TIF4 in vegetative growing cells. (A) EMSA analysis of extracts prepared from purified micro- and macronuclei. Extracts were prepared from equal numbers of purified micro- and macronuclei. The nuclear input for each binding reaction is indicated. (B) Western blot analysis of whole-cell lysates (wcl) and lysates from purified micronuclei (mic) and macronuclei (mac). Extracts derived from equivalent numbers of micro- and macronuclei were loaded. Upper panel, p69 Western blot with X. laevis Orc2 antibodies. Middle and lower panels, Western blot analysis with antibodies specific for the macronuclear-limited histone H2 hv1 variant and micronuclear-limited histone H1-like α-peptide subunit.

