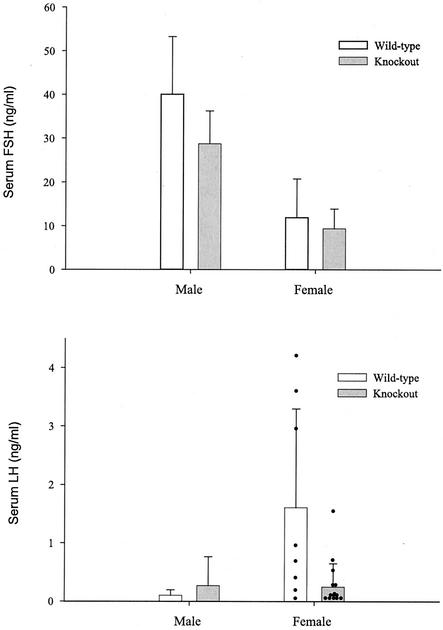
FIG. 6.
Serum gonadotropin levels. Radioimmunoassays for FSH (top) and LH (bottom) indicated that serum gonadotropin levels were not significantly affected by the mutation (data reflect the means ± standard deviations). Note that in the LH graph, individual data points are presented for females (black dots). While the two groups do not differ significantly, the large variability observed in the female wild-type group appears to result from elevated LH levels in three animals. An LH surge or pulse was observed in only one of the knockout females. The animals used in these studies were randomly cycling, and these data reflect the normal variability observed when animals are sampled in this fashion.

