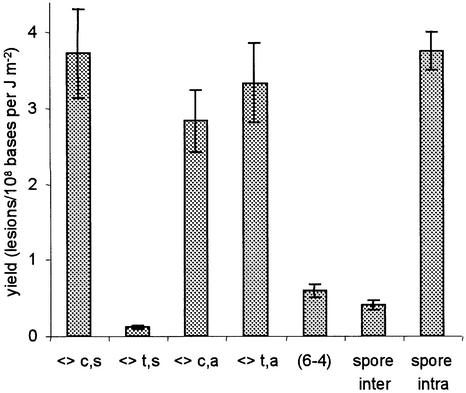
Figure 7.
Distribution of inter-strand lesions and spore photoproducts within isolated DNA exposed to UVC light in aqueous solution containing 80% ethanol. Each value represents the yield of formation (± SE) obtained by linear regression of the level of lesion with respect to the applied dose (n = 12).

