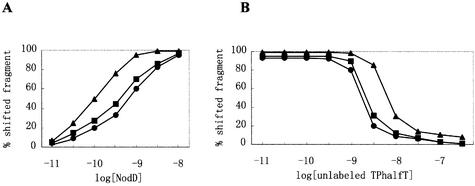
Figure 3.
Binding of NodD to DNA fragments TnodboxT, TDhalfT and TPhalfT. (A) NodD–DNA binding isotherm curves as a function of the increasing concentration of NodD. The labeled DNA fragments TnodboxT (triangle), TDhalfT (square) and TPhalfT (circle) were added in at a final concentration of 1 × 10–13 M. (B) Competition titration of NodD–TnodboxT (triangle), NodD–TDhalfT (square) and NodD–TPhalfT (circle) with added unlabeled TPhalfT. NodD was added at a final concentration of 0.4 ng/µl, and the labeled DNA fragments at 1 × 10–12 M.

