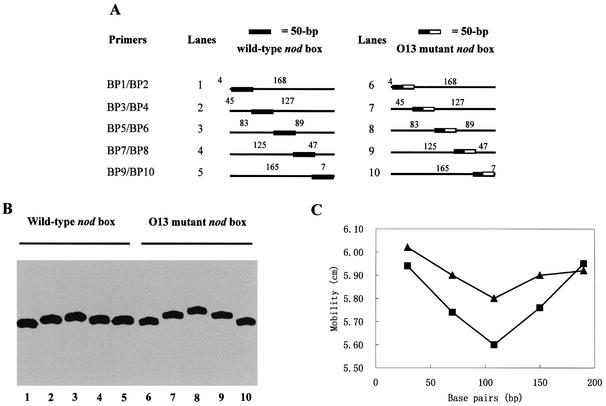
Figure 7.
Determination of NodD-induced DNA bending on the wild-type nod box and the O13 mutant nod box by circular permutation. (A) Five pairs of 222-bp radiolabeled DNA fragments used in (B) indicating the relative position of the NodD-binding site in relation to the ends of the fragments. (B) The mobility of NodD–DNA complexes using the DNA fragments listed in (A). Gel mobility shift assays were done with 1 pM DNA (lanes 1–10), 20 ng/µl ctDNA (lanes 1–10), 4 pg/µl (lanes 1–5) and 40 pg/µl (lanes 6–10) NodD. (C) Graphical representation of NodD-induced DNA bending on the wild-type nodA nod box (triangle) and the O13 mutant nod box (square). The mobility (in cm) of the NodD–DNA complexes is plotted against the number of bases between the left end of each fragment and the midpoint of the 50 bp nod box region. The bending angle by which DNA deflects from linearity is measured as described in Materials and Methods. The complexes with the intact D-half are calculated to have a 30° bend, while the complexes with the mutant D-half have a 44° bend according to an experiential formula.

