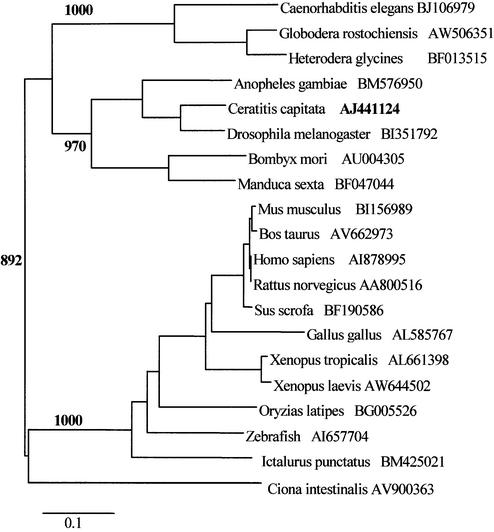
Figure 2.
A phylogenetic tree showing the relationships among the proteins of the Cc RNase family The phylogenetic tree was reconstructed by the neighbor joining method (28). The accession number following each species name refers to the EST sequence used in this study. Bootstrap values (>50%) are shown on interior branches. The scale bar beneath the tree represents 10 substitutions per 100 residues.

