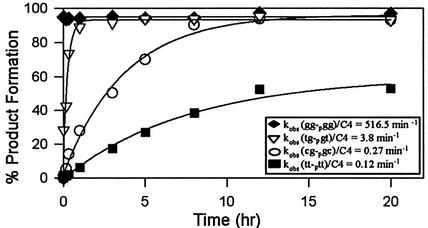
Figure 5.
Time-dependent ligation reactions. The optimum reaction conditions were used, which are 30 mM Tris–HCl (pH 7.5), 10 mM DTT, 3 mM MgCl2, 10 µM ATP, 20% DMSO, 2.5 pmol acceptor molecule, 70 fmol donor molecule, 3.125 pmol C4 template and 3 U T4 DNA ligase at 22°C. The graph shows the plots and fitted curves of each of the four ligation reactions analyzed (see inset for oligonucleotide sequences). The observed rate constants (kobs) for each reaction are given on the graph. The data points are the average of two independent assays.

