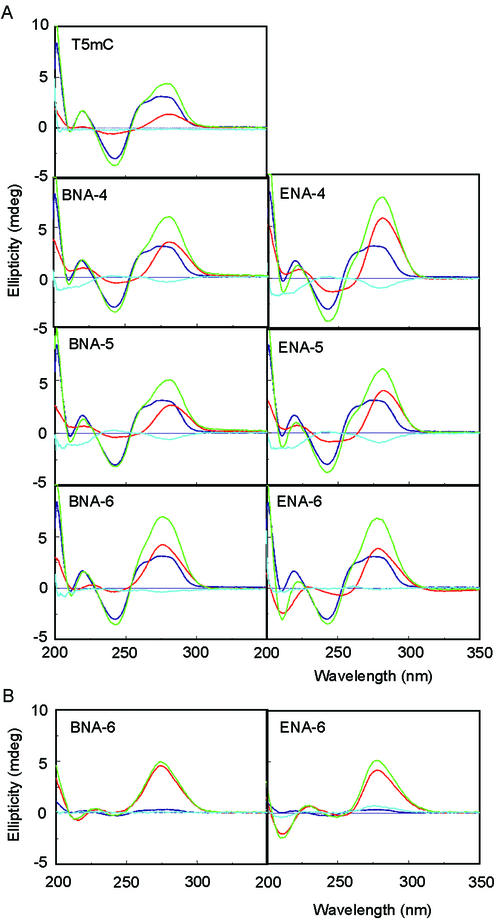
Figure 3.
CD spectra of triplexes. (A) dsDNA:TFO, 1:1; (B) dsDNA:TFO, 1:10. The buffer was 10 mM sodium cacodylate (pH 6.8), 200 mM NaCl and 20 mM magnesium chloride. Red, TFO only; purple, dsDNA only; green, complex between TFO and the dsDNA; blue, CD spectra of the complex between TFO and the dsDNA (green) minus that of the dsDNA (purple) and TFO (red).

