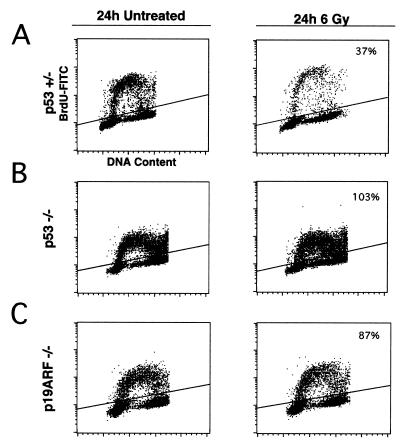
Figure 3.
Defective DNA-damage response in p19ARF-null MEFs. Asynchronous cultures of p53+/−, p53−/−, and p19ARF−/− MEFs were exposed to 6 Gy of γ-radiation. After 24 h, cells were pulse labeled with BrdUrd and analyzed by FACS. Cells above the diagonal line are BrdUrd positive. The values shown in the upper right represent the percentage of irradiated cells in S phase relative to untreated (% S irradiated/% S untreated). Representative plots are shown for p53+/− (A), p53−/− (B), and p19ARF−/− (C).

