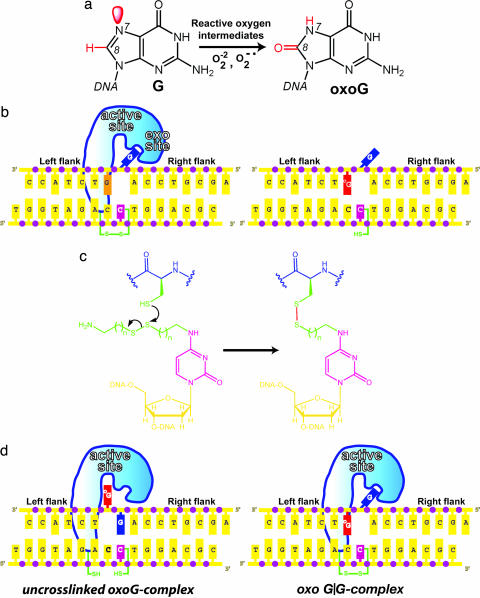
Fig. 1.
Schematic overview of the DXL experimental strategy. (a) Oxidation of G to oxoG. Red denotes the differences in structure between the two. (b) The left-hand schematic illustrates the G complex, with the extrahelical target G (blue) in the hOGG1 exo-site flanking the active site. Replacement of the G (orange) neighboring the target G with oxoG (red) gives the sequence on the right, which was used in this study. (c) Disulfide cross-linking chemistry. (d) Two possible DNA-bound structures formed between N149ChOGG1 and the DNA used in this study. See the text for details.

