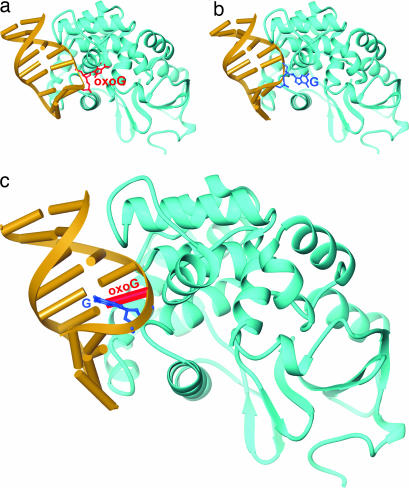
Fig. 2.
Overall structures of hOGG1–DNA complexes. In each structure, hOGG1 is represented as a blue ribbon trace and the bound DNA as a yellow ribbon-and-cylinders drawing. The target base in each is shown in a framework model, and its identity is denoted. (a) oxoG lesion-recognition complex (LRC) (11). (b) G complex (20). (c) oxoG|G complex.

