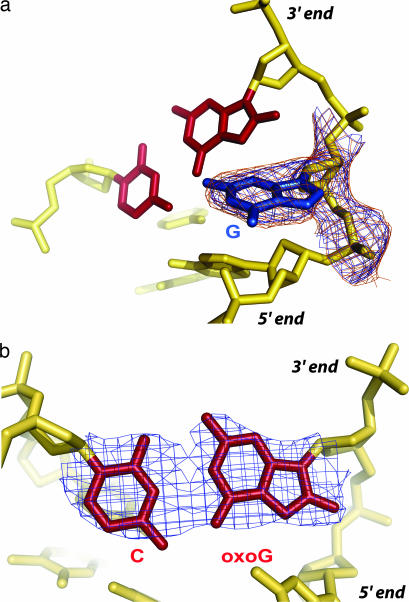
Fig. 3.
Electron density at the site of the target G and the neighboring oxoG:C base pair. The oxoG:C base pair is colored in maroon and the extruded G is colored in blue. Shown are σA weighted (27) 2Fo − Fc maps for particular elements in the DNA. (a) Target G; map contoured at 1σ (blue) and 0.8σ (orange). (b) Neighboring oxoG:C base pair; map contoured at 1.5σ. In b, the oxoG appears to adopt a 2′-endo sugar pucker with a C2′-O8 distance of 3.1 Å. The 5′ and the 3′ directions of the oxoG-containing strand are indicated.

