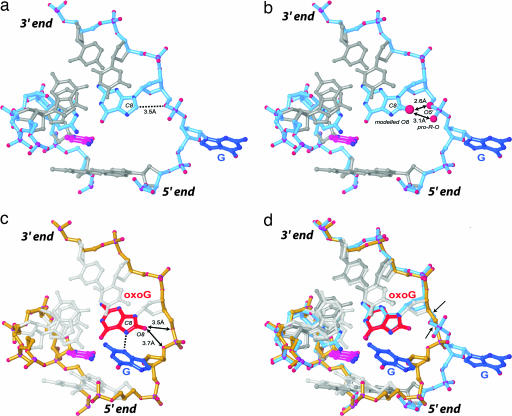
Fig. 4.
Close-up views of the DNA conformation in hOGG1-DNA complexes. Shown are framework models of the DNA, with the G complex having a blue backbone and the oxoG|G complex a yellow backbone. The target G in blue, its Watson–Crick pairing partner in magenta, and the neighboring oxoG in red. (a) The G complex. (b) Model constructed by addition of an 8-carbonyl onto the G residue 3′-neighboring the target G. Note the short distance between O8 and its own O5′ and pro-R-O, indicative of a steric clash between O8 and O5′, and a repulsive electrostatic interaction between the O8 and pro-R-O. (c) oxoG|G complex, with arrows denoting the distance between O8 and the nearest two backbone atoms. (d) Superposition of the G complex and the oxoG|G complex. Arrows in d denote the two bonds that undergo the largest rotation to convert from one DNA conformation to the other. The 5′ and the 3′ directions of the oxoG-containing strand are indicated.

