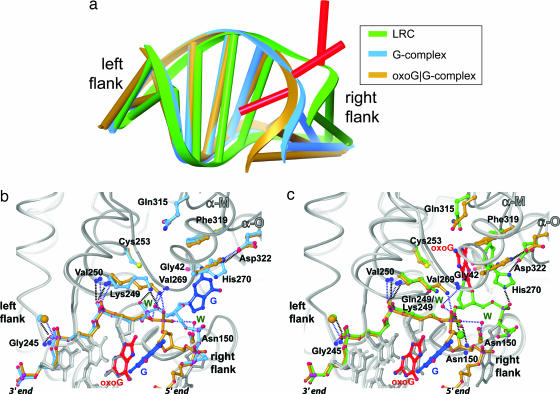
Fig. 5.
Structural changes along the base-extrusion pathway of hOGG1. (a) Global changes in DNA structure. These figures were created by superposition of the protein component only of the LRC, G complex, and oxoG|G complex. The protein is not displayed, but the DNA bound to it is, with the color scheme as shown in the Inset. Note that the differences in conformation are limited to the target nucleoside (red) and right flank. (b and c) Protein-only superpositions of the protein–DNA interfaces, illustrating the similarities and differences in the interfaces. Contacts are denoted with hashed lines; blue for the oxoG|G complex and black for the LRC or the G complex; blue spheres, backbone amide NH atoms; W, ordered waters; oversized spheres, Ca2+ ions. (b) oxoG|G complex versus G complex. (c) oxoG|G complex versus LRC.

