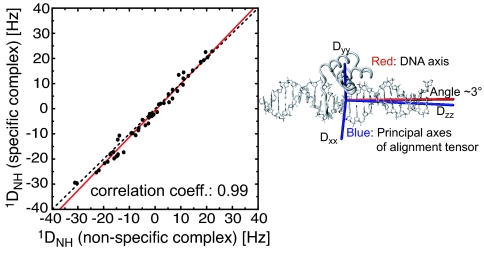
Fig. 4.
Correlation between Pf1-induced 1DNH RDCs measured on the nonspecific (Nhb) and specific (Shb) HoxD9–DNA complexes. The red line is the linear regression (slope of 1.06). The data extend from residues 2–60 and include both the N-terminal arm (residues 1–9) and the core domain. The Pf1 concentration was 12 mg/ml, and the buffer contained 10 mM Tris·HCl (pH 6.8) and 20 mM NaCl. The quadrupole splittings of the solvent 2H resonance were 9.7 and 9.4 Hz for the nonspecific and specific complexes, respectively.

