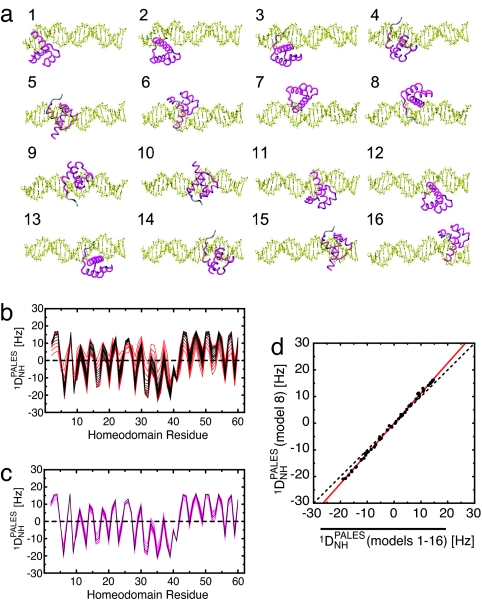
Fig. 5.
Prediction of Pf1-induced 1DNH RDCs for nonspecific complexes based on three-dimensional shapes and charge distribution using the program PALES (26). (a) Sixteen structure models for nonspecific complexes along a 24-bp DNA duplex with HoxD9 binding to DNA in the same binding mode but at different locations. Model 8 corresponds to the HoxD9–specific complex. (b) Predicted 1DNH RDCs for each residue. Results for models 1–16 are plotted (black, models 4–13; red, models 1–3 and 14–16). (c) 1DNH RDCs predicted for the specific complex (equivalent to model 8, black) and the average of the 1DNH RDCs predicted for 10 contiguous models (magenta; 7 lines correspond to averaging for models 1–10, 2–11, 3–12, 4–13, 5–14, 6–15, and 7–16). (d) Correlation between predicted 1DNH RDCs for the specific complex (model 8) and the average 1DNH values obtained for all 16 complexes. The red line is the linear regression (slope of 1.13). Further details are given in the supporting information.

