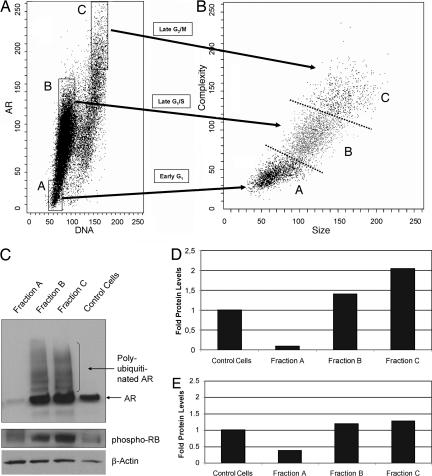
Fig. 2.
AR protein decreases in mitosis in AS prostate cancer cells. (A) Exponentially growing LNCaP cells in the presence of 1 nM R1881 were analyzed by dual-parameter FACS analysis, and subsequent fractions of cells were sorted on the basis of AR expression and DNA fluorescence. (B) Forward-side scatter analysis of LNCaP cells shows that fraction B cells are significantly larger and more complex than fraction A cells, and fraction C cells are significantly larger and more complex than fraction B cells. (C–E) Western blot analyses and quantitation of AR and phospho-Rb protein expression in sorted A, B, and C fractions and exponentially growing LNCaP control cells. Quantitation of Western blot analysis is presented in D [folds of AR levels (normalized per actin)] and E [folds of phospho-Rb levels (normalized per actin)].

