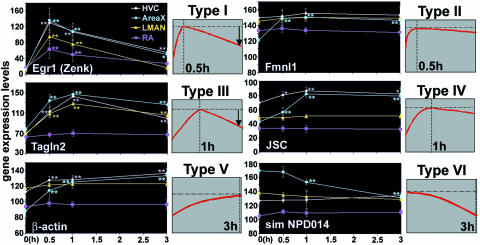
Fig. 4.
Examples of the six types of temporal expression patterns. The large graphs show the average mRNA-expression time course in four song nuclei. Bars represent SEM. The small graphs show schematics. Vertical line, time of measured peak expression; horizontal line, peak expression level. Criteria for including a gene as singing-regulated were that it had to have a significant difference at one or more time points relative to silent controls (0 h; ANOVA by post hoc probable least-squares difference test; ∗, P < 0.05; ∗∗, P < 0.01; n = 4 each time point, n = 5 at 0.5 h). Criteria for placing genes in a temporal category were that the gene had to have or not have significant differences in expression among the 0.5-, 1-, or 3-h time points (ANOVA, P < 0.05; specific values not shown).

