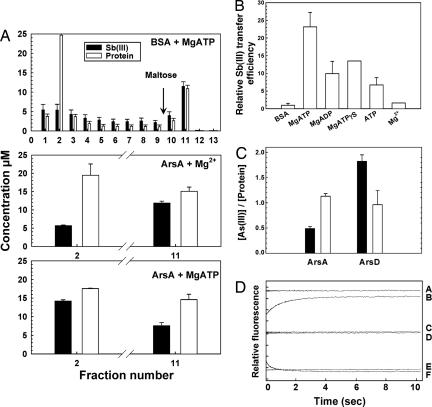
Fig. 3.
ArsD transfers metalloid to and activates the ArsA ATPase. (A) ArsA releases Sb(III) from ArsD. Sb(III)–MBP–ArsD was bound to a 2-ml amylose column. One milliliter of either 20 μM ArsA or BSA preincubated with 1 mM MgCl2 or MgATP was applied to the column. The column was washed with 8 ml of column buffer, and MBP–ArsD was eluted with 4 ml of 10 mM maltose. The protein in each fraction was identified by SDS/PAGE. BSA or ArsA eluted primarily in fraction 2, and most of the MBP–ArsD eluted in fraction 11. The molar concentration of each protein in the fractions was estimated from the absorption at 280 nm (white bars), and amount of Sb(III) was determined by inductively coupled plasma mass spectroscopy (black bars). (B) A nucleotide enhances the ArsA-induced release of Sb(III) from ArsD. Sb(III) release from ArsD was assayed in the presence of the indicated nucleotides and is expressed relative to the values with BSA. The values are the average of two independent assays. (C) ArsD transfers As(III) to ArsA. The molar ratio of As(III) to either ArsA or ArsD monomer was measured with protein either alone (black bars) or in the presence of the partner protein (white bars). The values are the mean of three independent assays. (D) The transfer of Sb(III) from ArsD to ArsA time-resolved by stopped-flow fluorescence spectroscopy. Equal volumes of the following reagents were mixed in a stopped-flow device, and the changes in protein fluorescence (excitation = 285 nm; emission >340 nm) monitored. Curve A, 2 μM ArsD + 10 μM ArsA; curve B, 2 μM ArsD/10 μM Sb(III) + 10 μM ArsA; curve C, 10 μM ArsA + buffer; curve D, 10 μM ArsA + 10 μM Sb(III); curve E, 2 μM ArsD + 10 μM Sb(III); curve F, 2 μM ArsD/10 μM Sb(III) + buffer. Each division on the y axis represents a fluorescence change of 5% relative to that of 2 μM ArsD/10 μM ArsA.

