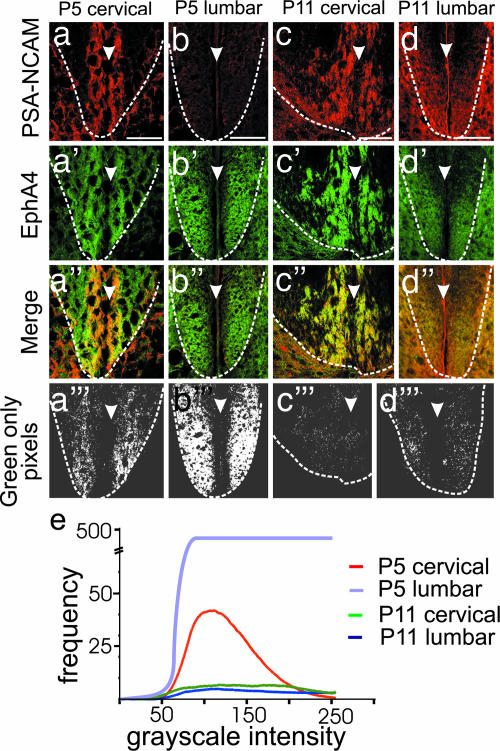
Fig. 2.
Expression of EphA4 in the environment of the CST axons decreases in the DF between P5 and P11. (a–d‴) Sections of the ventral DF at P5 cervical (a) and lumbar (b) and P11 cervical (c) and lumbar (d) levels are shown. a–d show PSA-NCAM expression in red, which identifies CST axons. a′–d′ show EphA4 expression in green. a″–d″ show merged images of PSA-NCAM and EphA4 labeling with regions of overlap in yellow. An imaging program (AnalySIS) was used to select the green-only pixels from the merged images (a‴–d‴), shown in white. Dotted lines in a–d‴ indicate the ventral boundary of the DF. Arrowheads indicate the midline of the spinal cord. (Scale bars, which apply to a–d‴: 100 μm.) (e) The frequency and intensity of green-only pixels in a‴–d‴ were quantitated and are shown as a histogram. The intensity of green-only pixels in the P5 lumbar cord was 10-fold higher, and the scale of the y axis has been adjusted accordingly.

