Fig. 1.
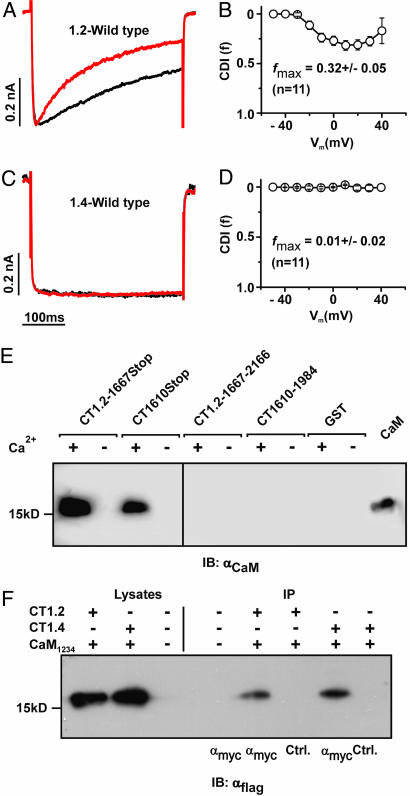
Cav1.4 binds CaM but does not reveal CDI. (A) Representative traces of ICa (red traces) and IBa (black traces) through Cav1.2 evoked by stepping from a holding potential of −80 mV to +10 mV. Current traces were normalized to peak current. Throughout, Ba2+ traces for CDI are scaled to match Ca2+ traces (scale bar) (B) Strength of CDI, f, in relation to voltage for Cav1.2. fmax is the maximal f value, n number of cells. (C and D) Representative ICa and IBa currents (C) and voltage-dependence of f for Cav1.4 (D). (E) GST fusion proteins containing fragments corresponding to the proximal and distal C terminus of Cav1.2 (CT1.2-1667Stop and CT1.2-1667–2166) or Cav1.4 (CT1610Stop and CT1610–1984) were incubated with CaM in the presence (+) or absence (−) of Ca2+. Immunoblotting was performed with an anti-CaM antibody. In the last lane, 1 μg of CaM was blotted to demonstrate specificity of the assay. (F) Co-IP of HEK293 cells coexpressing triple flag-tagged CaM1234 together with the myc-tagged full-length C terminus of Cav1.2 (CT1.2) or Cav1.4 (CT1.4). Lysates were immunoprecipitated with anti-myc (lanes 5 and 7) or anti-GST (control, lanes 6 and 8), blotted and probed with anti-flag. Lane 3 and 4: negative control.

