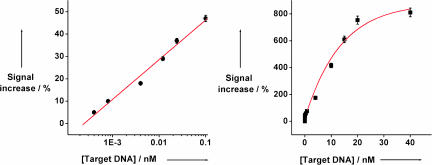
Fig. 3.
The dynamic range of the signal-on E-DNA sensor covers target concentrations from 400 fM to ≈20 nM. The error bars represent the SD of four AC voltammetric scans conducted with a single electrode at each target DNA concentration. Multiple matched electrodes were used to collect this data set.

